Every data engineer has been there: a critical dashboard is lagging, a pipeline is stalling, or your Snowflake compute costs just spiked overnight. Historically, finding the bottleneck meant manually digging through QUERY_HISTORY, meticulously studying execution times, or trying to decipher intricate Query Profiles step-by-step.
But Snowflake has shifted the paradigm from **reactive guessing** to **proactive optimization** with its native **Query Insights** engine.
Instead of forcing you to hunt for performance anti-patterns, Snowflake automatically analyzes your queries and surfaces actionable optimization diagnostics. Even better? You can audit these insights at scale using the SNOWFLAKE.ACCOUNT_USAGE.QUERY_INSIGHTS view.
Here is everything you need to know to leverage this view to cut down your debugging time and save on warehouse credits.
## What is the QUERY_INSIGHTS View?
Query Insights is a built-in diagnostic engine that evaluates queries against common SQL performance anti-patterns. While these insights are visible inline within the Snowsight UI (under the *Query Profile* tab), Snowflake exposes them programmatically in the ACCOUNT_USAGE schema.
The QUERY_INSIGHTS view records a dedicated row for every single query that triggers a performance flag.
### Key Columns to Watch:
* QUERY_ID: The unique identifier of the executed query (links directly back to QUERY_HISTORY).
* INSIGHT_TYPE_ID: A standardized string identifier indicating *why* the query flagged (e.g., missing filters, unselective predicates, or exploding joins).
* MESSAGE: A semi-structured VARIANT payload detailing exactly where and how the query plan broke down.
* SUGGESTIONS: An array of actionable, text-based recommendations on how to remediate the issue.
* IS_OPPORTUNITY: A boolean flag (TRUE/FALSE) indicating whether applying the suggestion will yield measurable performance or cost benefits.
## Common Insight Types (And What They Mean)
Snowflake doesn’t just tell you a query is “slow”—it targets the specific architectural root cause. Here are some of the most critical INSIGHT_TYPE_ID values you will encounter:
### 1. The Filtering Bottlenecks
* QUERY_INSIGHT_NO_FILTER_ON_TOP_OF_TABLE_SCAN: The query is scanning a massive table completely wide open without a WHERE clause. This results in heavy remote disk I/O.
* QUERY_INSIGHT_FILTER_NOT_SELECTIVE: A filter exists, but it doesn’t effectively prune micro-partitions (e.g., filtering on a column where almost every row matches).
* QUERY_INSIGHT_LIKE_FILTER_WITH_LEADING_WILDCARD: A clause like WHERE column LIKE ‘%value’ is being used, forcing a full scan because Snowflake cannot prune data using a leading wildcard.
### 2. Exploding Joins
* QUERY_INSIGHT_EXPLODING_JOIN: One of the most powerful diagnostic additions. This flags instances where a join operation causes an accidental, massive Cartesian-like row multiplication. It pinpoints the exact join step causing data bloat, helping you catch bad join keys before they exhaust your warehouse memory.
### 3. Optimization Wins
* QUERY_INSIGHT_QUERY_BENEFITED_FROM_SEARCH_OPTIMIZATION: A positive insight confirming that your Search Optimization Service (SOS) configuration is actively speeding up your point lookups.
## Actionable SQL: Finding Your Low-Hanging Fruit
Because this data lives in a standard table format, you can write analytical queries to find the absolute worst-performing queries across your entire account.
Use this script to pull your top 10 optimization opportunities from the past week:
“`sql
SELECT
query_id,
insight_type_id,
suggestions,
start_time,
end_time
FROM
SNOWFLAKE.ACCOUNT_USAGE.QUERY_INSIGHTS
WHERE
is_opportunity = TRUE
AND start_time >= DATEADD(‘day’, -7, CURRENT_TIMESTAMP())
ORDER BY
start_time DESC
LIMIT 10;
“`
### Unpacking the MESSAGE Payload
Because the MESSAGE column is a variant, you can flatten or query it to extract specific metrics—such as the exact table name causing a full scan or the exact row-expansion ratio of an exploding join.
## Know the Limitations
Before building automated alerting pipelines around this view, keep a few guardrails in mind. Snowflake **does not** currently generate insights for:
* Queries that reuse previously cached results.
* Queries involving secure objects or secure views.
* Queries executed against Hybrid Tables (Unistore workloads).
* Queries generated dynamically by Native Apps.
* EXPLAIN statements.
Additionally, data in the ACCOUNT_USAGE schema is subject to a latent processing delay (typically up to a few hours), meaning it is perfect for daily FinOps audits and trend tracking, but not for real-time monitoring.
## Summary: Move from Guessing to Engineering
The QUERY_INSIGHTS view fundamentally changes how data teams approach performance tuning. Instead of waiting for a developer to manually dissect a query profile, you can build dashboards that flag exploding joins, isolate wildcards, and highlight un-pruned table scans automatically.
By integrating QUERY_INSIGHTS audits into your weekly or monthly review cycles, you can systematically optimize your code, accelerate pipeline SLAs, and maintain a highly cost-efficient Snowflake footprint.
*Have you started exploring the QUERY_INSIGHTS view yet? What is the most common anti-pattern popping up in your environment? Let’s chat in the comments!*
Execution Plans
Which came first? The Select or the Into?
This morning while discussing things vaguely reminiscent of work with a colleague of mine the topic of Russell’s paradox was broached. Russell’s paradox relies the concept of a set of sets that do no contain themselves as members. It is a paradox because if that set does not contain itself it satisfies the requirement of membership and then must therefore contain itself, which would be a violation of the rules required for membership. Long story short humanity innovated and a guy named Ernst Zermelo contributed some rules that don’t allow such paradoxes. Zermelo actually discovered the paradox first but didn’t publish. That was confirmed a guy named David Hilbert who drew a really great looking space filling curve with a few simple steps repeated infinitely. The talk of Russell’s paradox prompted me to write the following SQL:
SELECT * INTO #temp FROM tempdb.sys.tables;
SELECT * FROM #temp;
I then posed the question: Will #temp appear as a member of the rows returned from #temp?

You can see an instance of #temp does in fact appear. The suffix appended to it uniquefies the name. This is what allows for multiple temp tables of the same name to be created. We can see this by running the above query in another tab (which opens another session).
 The reason that we don’t see the table excluded from the results set is that in order for the temp table to hold the data from the sys.tables catalog view it must exist. And if it exists it will appear in the catalog. This helps to illustrate that SQL is not (always) a procedural language, or that INTO does not logically mean CREATE and INSERT.
SQL is usually typified of a declarative programming language. Being a declarative programming language means that we are not telling the database how to do what we want, only what we want. In this case we told it we want a table that matches the definition of sys.tables and we want it filled with the contents of sys.tables. Contrast this with the having asked SQL to take the contents of sys.tables and put it into a table that matches the definition of sys.tables. In the first case we have to first make the table which puts it into sys.tables, in the second we take the contents of sys.tables and then put it into our newly created table.
This might become clearer if we examine a query plan.
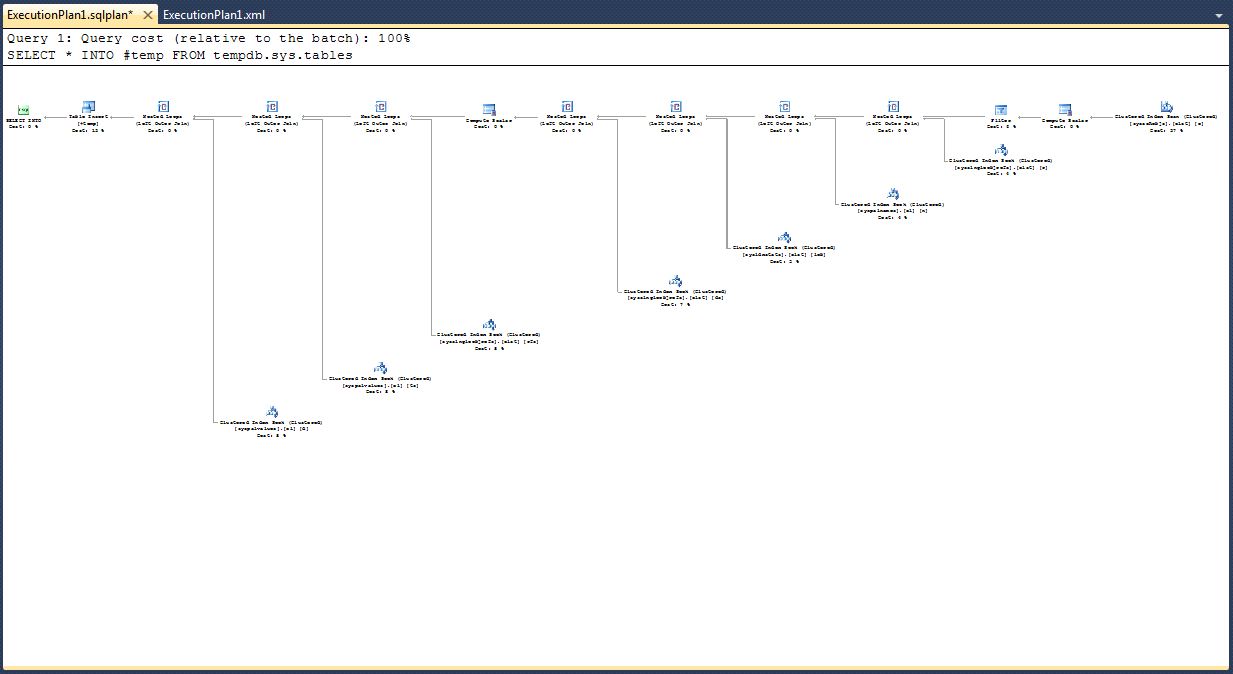
We can clearly see from the plan that sys.tables is a view that draws from the inaccessible mssqlsystemresource system database. It might look like all of those branches contribute to building the table to insert into, but that is just where the data comes from. A simpler select into plan can be seen if we select from a table valued function (TVF).

Here we can see that the Table Insert showplan operator occurs before the Select Into operator. That doesn’t actually create the table, though. The table is created by a Data Definition Language (DDL) operation. DDL operations don’t produce showplan operators. So there you have it, moderately conclusive proof that the table does exist before the read of data to insert occurs, and some vague syntactic hints at why.
.

